Insights / Energy
EnergyTOPCon vs HJT: UAE guide to bifacial yield, heat and reliability
· 8 min read
On this page
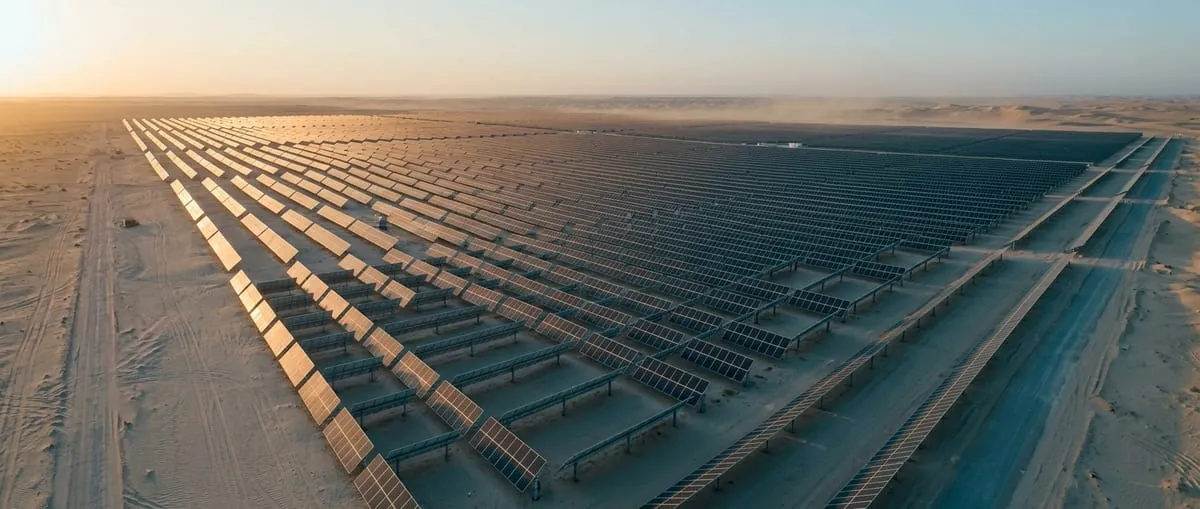
TOPCon vs HJT: UAE project teams face this module choice early in every solar design. Both are n-type, high-efficiency and bifacial. The differences show up in desert heat, on bright sand and in long-term reliability.
This guide uses measured lab data and satellite-based yield models to size those differences. It also gives you a calculator to test them for your own site.
Why does heat matter so much for UAE solar modules?
Solar cells lose power as they get hotter. The temperature coefficient tells you how much. A module rated at -0.30 %/°C loses 0.3% of its power for every degree above 25 °C.
In the Gulf, cells run hot for much of the year. The EU’s PVGIS model puts combined temperature and low-light losses at about 10.5–12.4% of annual output for a standard crystalline module in Abu Dhabi, Dubai, Doha, Riyadh and Muscat. That is a large slice of energy, so a better coefficient is worth real kilowatt-hours.
Kiwa PVEL’s 2025 reliability scorecard reports the average coefficients from its tests:
| Technology | Temperature coefficient (Pmax) | Average bifaciality | Low-light loss |
|---|---|---|---|
| PERC | -0.32 %/°C | 68.7% | -4.2% |
| TOPCon | -0.29 %/°C | 76.3% | -3.8% |
| HJT | -0.25 %/°C | 85.5% | -3.2% |
HJT leads on all three measures. TOPCon sits between HJT and the older PERC design.
How big is the temperature advantage in practice?
Our model assumes an energy-weighted cell temperature about 35 °C above 25 °C. That estimate follows from the PVGIS loss figures above. At that temperature, TOPCon gains about 1.1% over PERC, and HJT gains about 2.5%.
So HJT’s heat advantage over TOPCon is roughly 1.4% of annual energy. It is real, but it is not huge. Keep that number in mind when you compare quotes.
TOPCon vs HJT: UAE yield, how much will each produce?
Use the estimator below to compare the three technologies for six MENA cities. It starts from PVGIS yields for a fixed, optimally tilted system. Then it applies the lab-measured coefficients, a bifacial gain and an optional tracker gain.
Interactive estimate
Solar yield estimator: PERC vs TOPCon vs HJT
From 1 kWp up to 500 MWp.
Annual energy
1,872.8 MWh
Specific yield
1,873 kWh/kWp
CO₂ avoided
876 t/yr
Assumptions
- Base yield: EU JRC PVGIS 5.3 (SARAH3), fixed mount at optimum tilt, monofacial c-Si, 14% system losses. Dubai 1,722, Abu Dhabi 1,753, Riyadh 1,777, Muscat 1,755, Doha 1,712, Cairo 1,819 kWh/kWp/yr.
- Temperature coefficients (Pmax): PERC -0.32, TOPCon -0.29, HJT -0.25 %/°C (Kiwa PVEL 2025 Scorecard averages), applied over an energy-weighted 35 °C cell temperature rise. PVGIS already models PERC-like heat losses, so TOPCon and HJT get only the difference.
- Bifacial gain = bifaciality × 0.1 rear/front irradiance on bright desert sand. Bifaciality: PERC 68.7%, TOPCon 76.3%, HJT 85.5% (Kiwa PVEL 2025).
- Single-axis tracker gain from PVGIS for each city: Dubai 18.2%, Abu Dhabi 20.1%, Riyadh 19.1%, Muscat 17.6%, Doha 18.2%, Cairo 23.7%.
- CO₂ avoided uses 2024 grid intensity (Ember): UAE 0.468, Saudi Arabia 0.692, Oman 0.543, Qatar 0.582, Egypt 0.575 kg CO₂e/kWh.
- First-year estimate. Excludes soiling beyond the PVGIS loss figure, degradation, clipping, curtailment and site shading.
Indicative estimate only. Contact us for an engineered proposal.
For a 1 MWp fixed bifacial plant in Dubai, the model gives about 1,873 MWh a year with TOPCon and 1,915 MWh with HJT. That is a gap of about 2.3%. Add a single-axis tracker and the figures rise to about 2,214 and 2,264 MWh.
These are first-year, indicative numbers. An engineered design adds soiling, shading, clipping and degradation. Our solar PV supply team can run that study with your layout.
What does PVGIS say about specific yield in the Gulf?
PVGIS is the European Commission’s free solar model. It uses satellite irradiance data and covers the Middle East and North Africa. We queried it for city-centre points with a fixed mount at the optimum angle and 14% system losses.
| City | Fixed optimum (kWh/kWp/yr) | Single-axis tracker gain |
|---|---|---|
| Dubai | 1,722 | 18.2% |
| Abu Dhabi | 1,753 | 20.1% |
| Riyadh | 1,777 | 19.1% |
| Muscat | 1,755 | 17.6% |
| Doha | 1,712 | 18.2% |
| Cairo | 1,819 | 23.7% |
The Gulf cities sit within about 4% of each other. Cairo is higher and gains more from tracking. Your own site may differ from the city centre, so treat these as a starting point.
How much does bifacial gain add on desert sand?
A bifacial module also collects light that bounces off the ground onto its rear face. The gain depends on ground brightness (albedo), mounting height, row spacing and the module’s bifaciality.
The IEA’s photovoltaic programme reports that trackers over typical natural ground, with albedo of 0.2 to 0.3, usually see bifacial gains under 10%. Desert ground can be brighter. Satellite estimates for the Arabian Peninsula average above 0.35. A study of Chile’s Atacama Desert estimated bifacial gains of about 6–12% over similarly bright ground.
Our calculator assumes rear-side light equal to 10% of front-side light. Multiplied by each technology’s bifaciality, that gives a gain of about 6.9% for PERC, 7.6% for TOPCon and 8.6% for HJT. This is where HJT’s higher bifaciality turns into extra energy.
Should you use bifacial modules with trackers?
In most sunny markets, yes. A 2020 global study cited by the IEA found that bifacial modules on single-axis trackers give the lowest cost of energy for about 93% of the Earth’s land area. In the Gulf, PVGIS shows trackers alone adding 18–20%.
Trackers bring more moving parts, sand and wind loads, and O&M work. Our guide to single-axis trackers in the desert covers those trade-offs in detail.
Which technology is more reliable in hot, humid coastal sites?
Yield is only half the story. A module that degrades faster can erase a 2% energy edge within a few years. Kiwa PVEL’s 2025 scorecard gives useful signals, although sample sizes differ by technology.
- Thermal cycling: the median power loss after the test was 1.1% for TOPCon and 3.6% for PERC.
- Damp heat: 67% of TOPCon bills of materials stayed under 2% loss. The HJT sample was much smaller and none stayed under 2%.
- Glass-glass construction: TOPCon glass-glass modules lost a median 1.6% in damp heat, compared with 4.0% for glass-backsheet designs.
- UV-induced degradation: after UV exposure, median losses were 3.1% for TOPCon, 4.2% for HJT and 2.2% for PERC.
UV exposure is high across the UAE, so the UV result matters. The lab found that UV-blocking front encapsulants reduce this loss. Ask your supplier for UV test results and the encapsulant specification for the exact bill of materials you will receive.
What should you check in datasheets and test reports?
Two modules with the same model name can be built from different bills of materials. The glass, encapsulant, backsheet and cells may all change between batches. Kiwa PVEL tests each bill of materials separately for this reason.
The 2025 results show why that matters. 83% of manufacturers and 59% of bills of materials had at least one test failure. That is up from 66% and 41% in the 2024 scorecard.
Mechanical strength is a growing concern for tracker projects. The lab changed its static load test to use a tracker-style mounting, and 20% of bills of materials then had at least one failure. Most were glass breakage or frame damage. The lab linked this to thinner or weaker glass, weaker frames and larger module areas.
Two smaller performance points also matter in the Gulf:
- Low-light behaviour: average low-light losses were 3.2% for HJT, 3.8% for TOPCon and 4.2% for PERC. This affects mornings, evenings and dusty, hazy days.
- Angle of incidence: HJT modules showed lower incidence angle modifier values on average, although the sample was small. This slightly reduces the light they capture when the sun is at a steep angle to the glass.
Ask suppliers for the lab’s report on the exact bill of materials you are buying. Check that the modules you receive match that bill of materials. Our solar PV team can supply test reports on request.
Is TOPCon or HJT easier to source at scale?
TOPCon is now the mainstream choice. The 2025 International Technology Roadmap for Photovoltaics reports that n-type TOPCon overtook p-type PERC in 2024. Global module shipments reached a record 703 GW that year. Bifacial cells hold about 90% of the market.
HJT is growing but remains a smaller share of production. That can mean fewer suppliers, longer lead times or a price premium. For a large plant, the supply picture often decides the choice before yield does.
How should UAE buyers decide between TOPCon and HJT?
Start with the numbers that move your project economics most. Tracking and bifaciality usually matter more than cell type. Then compare TOPCon and HJT on a like-for-like basis.
- Model your site. Use PVGIS or a full simulation with each module’s own datasheet and test files.
- Price the energy, not the watt. Compare the cost per kWh over the project life, not the cost per kWp.
- Check reliability data. Ask for independent damp-heat, thermal-cycling and UV test results for the exact bill of materials.
- Match the inverter. Size strings from each module’s own datasheet voltages and temperature data. See our inverter comparison.
- Plan for storage. Midday solar often exceeds site demand. Our guide to sizing C&I battery storage in the GCC explains how to capture it.
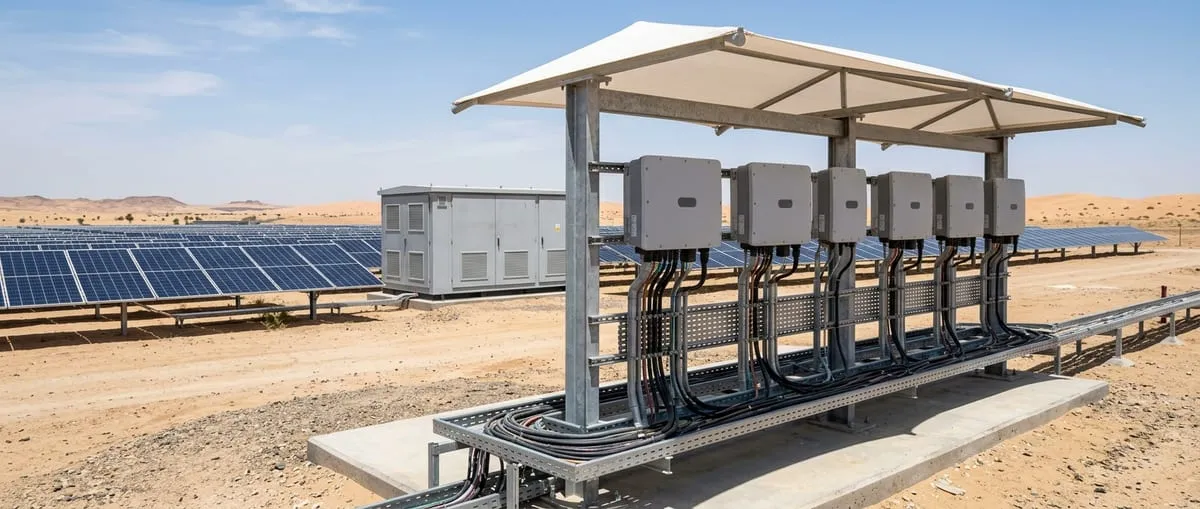
Balance-of-system parts matter too. Cables, combiner boxes and transformers must be rated for Gulf heat. Our balance-of-system range covers these items.
What does this mean for UAE carbon and energy targets?
The UAE Energy Strategy 2050 aims to triple the contribution of renewable energy by 2030. Every extra kilowatt-hour from better modules also cuts emissions. The UAE grid emitted about 468 g CO₂e per kWh in 2024, according to Ember data.
At that rate, a 1 MWp bifacial HJT system on fixed mounts in Dubai avoids about 896 tonnes of CO₂e a year in our model. A bifacial PERC system avoids about 861 tonnes. The calculator uses each country’s own grid factor.
Key takeaways
- HJT leads TOPCon on temperature coefficient (-0.25 vs -0.29 %/°C) and bifaciality (85.5% vs 76.3%) in 2025 lab tests.
- That adds roughly 1.4–2.3% energy in Dubai in our PVGIS-based model. It is a modest gain.
- Bifacial modules add about 7–9% on bright sand, and single-axis trackers add 18–20% in Gulf cities.
- Check UV, damp-heat and thermal-cycling results for the exact bill of materials before you buy.
- TOPCon is the market mainstream, which helps with supply and lead times.
Frequently asked questions
Is HJT always better than TOPCon in the UAE heat?
How much extra energy do bifacial modules give in the Gulf?
What specific yield should I expect for a fixed-tilt system in Dubai?
Do single-axis trackers pay off in the UAE?
Which module technology is most common today?
Sources
- European Commission Joint Research Centre –PVGIS 5.3 photovoltaic performance tool (PVcalc, PVGIS-SARAH3)
- Kiwa PVEL (copy hosted by QualEnergia.it) –2025 PV Module Reliability Scorecard: Executive Summary (PDF)
- Kiwa –Inside Kiwa PVEL's 2025 PV Module Reliability Scorecard
- VDMA –International Technology Roadmap for Photovoltaics (ITRPV), 16th edition, press release (15 April 2025)
- IEA PVPS –Bifacial Photovoltaic Modules and Systems: Experience and Results from International Research and Pilot Applications (Report IEA-PVPS T13-14:2021)
- Scientific Reports (Cordero et al., 2021) –Evaluation of MODIS-derived estimates of the albedo over the Atacama Desert using ground-based spectral measurements
- Our World in Data, based on Ember –Carbon intensity of electricity generation
- UAE Government portal –UAE Energy Strategy 2050